👮♂️ Identifying Hangs in iOS Apps 😰

Forget about Ruby and Fastlane installation issues!
Discover Codemagic CLI Tools - the free, open-source Fastlane alternative for automating iOS builds, code signing and publishing.
This message is brought to you by a sponsor who helps keep this content free for everyone. If you have a moment, check them out. Your support means a lot!
Welcome to issue #62 of the iOS Coffee Break Newsletter 📬.
In this week's issue, we will dive into a common performance challenge in iOS apps: UI hangs caused by intensive tasks running on the main thread 🥵.
We will also walk through how to analyze these hangs using Instruments. To illustrate this, I have put together a demo app with deliberately added code that causes the main thread to block. The app mimics a GET request to retrieve a list of newsletter's editions.
This guide was created using Xcode 16.4, but all instructions should remain current for Xcode 26.
What is a Hang?
A UI hang occurs when the app's interface stops responding for a noticeable amount of time. This typically results from long-running operations that occupy the main thread, which is responsible for updating the UI and processing user input.
Apple strongly recommends avoiding heavy processing on the main thread. Instead, these operations should be delegated to background threads.
The Plan
In this edition, the plan is to simulate blocking the main thread with heavy computations, leading to a UI hang. Here is a quick summary:
- Simulating a UI Hang
- Identifying the Hang using Instruments
Experiencing a Hang
The demo app includes two tabs: About and Issues. The hang occurs when navigating to the Issues tab.
We'll notice that tapping on the Issues tab doesn't trigger an immediate response. It takes about 4 seconds for the app to react before it displays several rows of issues.
During this delay, not only is the Issues tab inactive, but the entire app becomes unresponsive. We can't interact with any part of the UI until the content finally loads.
Detecting a UI Hang using Instruments
In Xcode, press and hold the Run button, then select Profile from the dropdown menu.
Alternatively, we can start profiling by navigating to Product > Profile or using the shortcut (Command-I).
Once Xcode finishes building our app, it will launch Instruments with your app as the target.
From the list of available templates, choose Time Profiler, then click Choose to proceed.
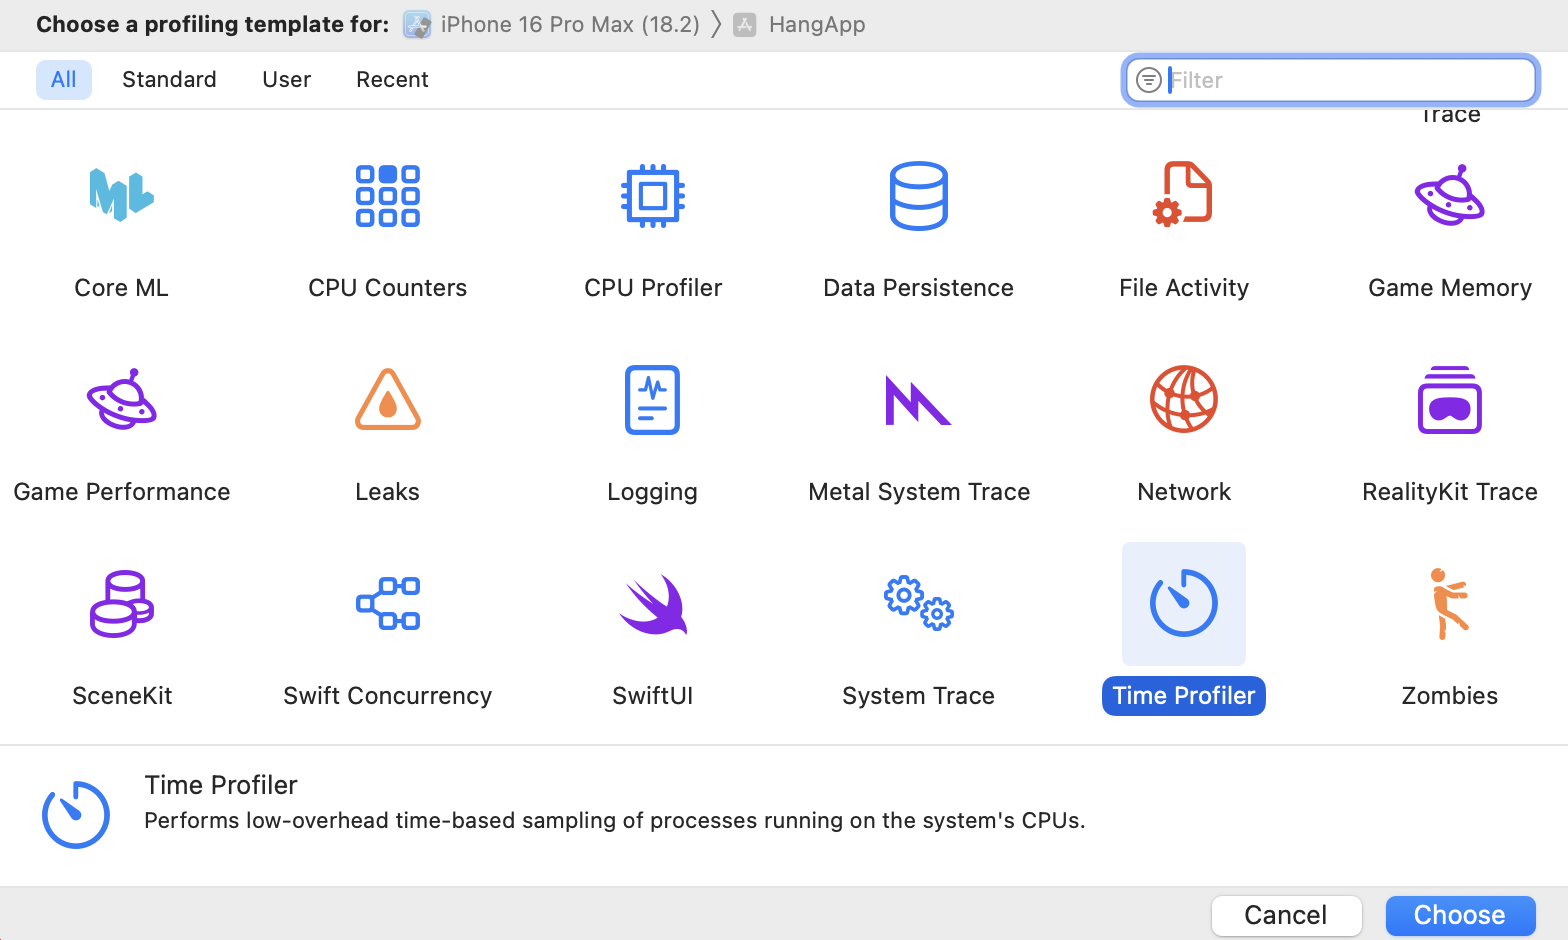
This will open a new Instruments session, preloaded with tools commonly used for analyzing time-based performance issues.
Recording a Session
Start by clicking the Record button to begin recording data.
Instruments will launch your app and begin tracking its activity.
To reproduce the issue, tap on the Issues tab in the app once again. After the hang is over, stop recording.
A large red rectangle will appear in the Hangs track, marking when the freeze began and how long it lasted.
Zooming to Inspection Range
Next, go to View > Zoom > Zoom to Inspection Range to narrow in on the relevant portion of the timeline.
Hover your cursor over the red block in the Hangs track to view a tooltip showing the precise length of the freeze. Here, we can see that the hang duration was almost 4 seconds - a Severe Hang.
🤝 Wrapping Up
In this chapter, we successfully simulated a UI hang, experienced how it affects app responsiveness, and gained a better understanding of its impact on the user experience. We also captured the hang using Instruments, allowing us to measure its duration and prepare for deeper analysis.
With the hang now identified, the next step is to investigate how much CPU activity is happening on the main thread. If the CPU usage is high, it suggests the main thread is overwhelmed with tasks; if it is low, the thread might be blocked entirely.
Sounds like a solid focus for next newsletter's edition, right? 🤔
Have any feedback, suggestions, or ideas to share? Feel free to reach out to me on Twitter.
Here is the GitHub repository link if you are interested.
Have a great week ahead 🤎